HIV Statistics
Syndemic Data
Syphilis
Annual syphilis screening increased from 5.7% in 2022 to 16.3% in 2024. (source: IHS Clinical Reporting System)
HCV
Since IHS initiated hepatitis C virus (HCV) screening of the birth cohort of “baby boomers” (persons born 1945-1965), HCV screening has increased from 8% to 73% of the IHS user population. Screening of all persons over 18 years of age for HCV has reached 58%. (source: Clinical Reporting System)
HIV
- Since the 2006 recommendation to screen all persons for HIV, IHS has screened 60% of its adolescent and adult patients. (source: IHS Clinical Reporting System)
- Between 2019 and 2024, 35% of all adolescent and adult active patients in the IHS system have been tested for HIV. (source: IHS Clinical Reporting System)
- From 2016 to 2022, new diagnoses in the IHS Areas with the highest HIV burden have dropped by 23%. (source: IHS National Data Warehouse/Division of Epidemiology and Disease Prevention with CDC collaboration)
- The largest HIV ART programs in IHS achieved 90% viral suppression among its patients with HIV in 2024. (source: annual facility reports from ART programs)
HIV DATA
View the latest data from the CDC on HIV by race and ethnicity.
HIV is a public health issue among American Indian and Alaska Native (AI/AN) people, who represent about 1.7% of the U.S. population. Compared with other racial/ethnic groups, AI/AN ranked fifth in the rate of new HIV diagnoses in 2024 1, with a rate of 9.2 (per 100,000 2) population as compared with Whites at 4.8 (per 100,000 population).
Key Statistics about HIV Among American Indian/Alaska Native People
Overall
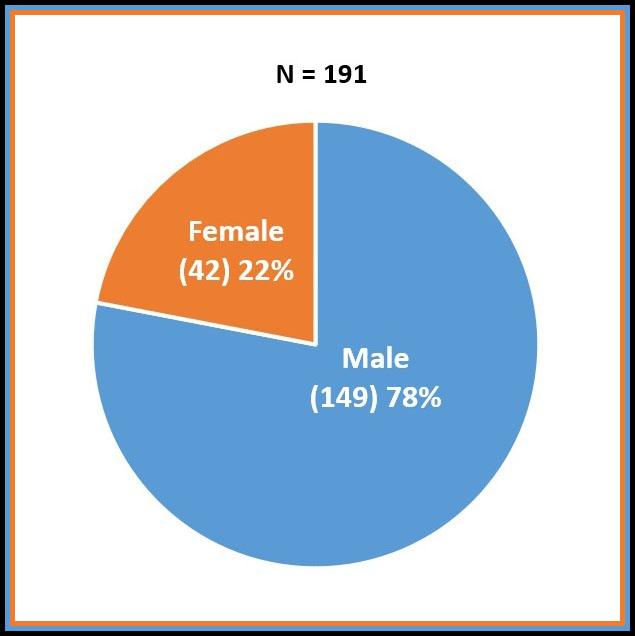
In 2024, there were 191 new diagnoses of HIV infection among AI/AN people.
- Up 2.1% from 187 in 2023.
- Up 15% from 166 in 2020.
By Sex
Males accounted for 149 (or 78%) of all new diagnoses.
- In line with 78.6% of all new HIV diagnoses in 2023.
- Up 14.6% from 130 new diagnoses in 2020.
Females accounted for 42 (or 22%) of all new diagnoses.
- Up from 21.4% of all new HIV diagnoses in 2023
- Up 16.7% from 36 new diagnoses in 2020.
By Age
25-34-year-olds (84 new diagnoses) and 35-44-year-olds (42 new diagnoses) together accounted for 66% of all new HIV diagnoses among AI/AN people.
By Mode of Transmission
- The primary mode of transmission among men is male-to-male sexual contact (116 new diagnoses out of 149 total diagnoses for men).
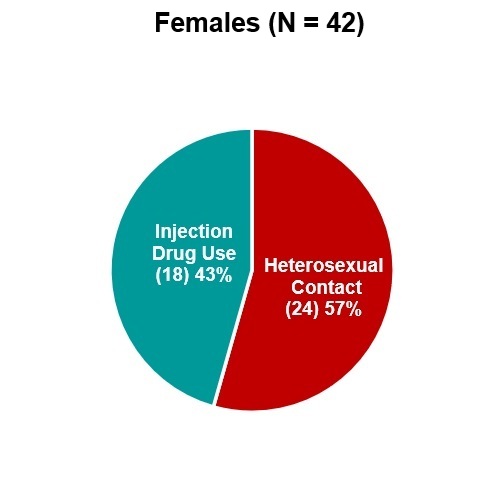
- Among women, the primary mode of transmission is heterosexual contact (24 out of a total of 42 new diagnoses among women).
Along the HIV Care Continuum in 2024
Out of every 100 AI/AN individuals with diagnosed HIV:
- 86.9% were linked to care within one month,
- 76.9% received some care,
- 70.7% had achieved viral suppression – slightly below the national average of 71.1%.
Disparities in HIV Experienced by American Indian/Alaska Native People
- In 2024, the rate of new HIV diagnoses among AI/AN people was 9.2 (per 100,000 population), nearly twice the rate of 4.8 (per 100,000 population) experienced by Whites.
- Between 2020 and 2024, new HIV diagnoses among AI/AN people increased by 15%, from 166 new HIV diagnoses in 2020 to 191 new HIV diagnoses in 2024.
- In 2024, the rate of diagnosis of HIV infection among AI/AN women was over twice as high as the rate of diagnosis among White women (4.0 vs 1.8 per 100,000, respectively)
- In 2024, AI/AN women diagnosed with HIV had the highest percentage (43%) of HIV infections attributable to injection drug use when compared to women in all other racial or ethnic groups.
HIV Diagnoses Among American Indian/Alaska Native People by Transmission Category and Sex, 2024 – United States
The 2024 data on American Indian/Alaska Native persons newly diagnosed with HIV in 2024 by sex shows that from a total sample of 191:
- Males accounted for 149 diagnoses, representing 78% of the total.
- Males represented more than three-quarters of all newly diagnosed HIV cases.
- Females accounted for 42 diagnoses, representing 22% of the total.
- Females accounted for slightly more than one-fifth of diagnoses.
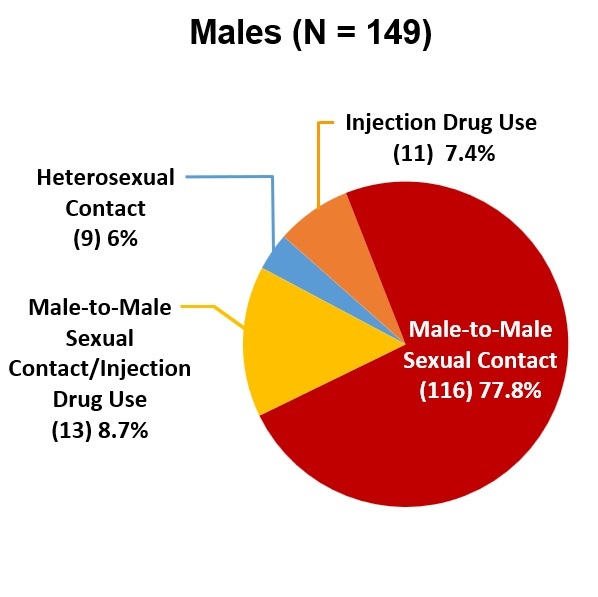
The terms male-to-male sexual contact (MSM) and male-to-male sexual contact and injection drug use (MSM/IDU) are used in CDC surveillance systems. They indicate the behaviors that transmit HIV infection, not how individuals self-identify in terms of their sexuality.
ADDITIONAL DATA RESOURCES
AtlasPlus – an interactive tool from the Centers for Disease Control and Prevention (CDC) that gives users the ability to create customized tables, maps, and charts using nearly 20 years of CDC’s surveillance data on HIV, viral hepatitis, STDs, and tuberculosis. AtlasPlus also provides access to indicators on social determinants of health (SDOH), allowing users to view social and economic data in conjunction with surveillance data for each disease.
America's HIV Epidemic Analysis Dashboard (AHEAD) – an interactive tool developed by the HHS Office of the Assistant Secretary for Health that displays national progress toward meeting the goals of the Ending the HIV Epidemic in the U.S. (EHE) initiative. Users can filter CDC data by race/ethnicity, age, sex at birth, gender, and mode of HIV transmission for the six EHE indicators.
HIV by Race and Ethnicity –While HIV affects all races and ethnicities in the United States and dependent areas, some groups are disproportionately affected compared to their population size. Get the latest data from the CDC on HIV by race and ethnicity.
1. HIV surveillance data for 2024 is the most recent data from the Centers for Disease Control and Prevention.
2. Unless otherwise noted, the source for all HIV surveillance data is the Centers for Disease Control and Prevention. NCHHSTP AtlasPlus. Accessed June 9, 2026.